Improving Research and Workflow with Mind Maps
If a picture is worth a thousand words, then a mind map is most likely worth a whole lot more. The following examples illustrate how mind mapping can be extremely useful for visualizing and supporting artificial intelligence (AI) projects and results. The following examples are not exhaustive; rather, they highlight a couple of use cases that demonstrate the breadth of possibilities offered by mind mapping in AI-related contexts.
Mind Mapping for AI Project Management
In AI projects focused on visual object detection and recognition, mind mapping can significantly improve visual project management by reducing complexity, saving time, and minimizing potential issues.
The first step when applying mind mapping to project management is to define the project charter and scope. A dedicated project charter mind map can be created to capture key elements, including the project overview, goals and objectives, requirements, milestones, risks, assumptions, constraints, stakeholders, and resources. In addition, a separate mind map for requirements documentation often proves valuable.
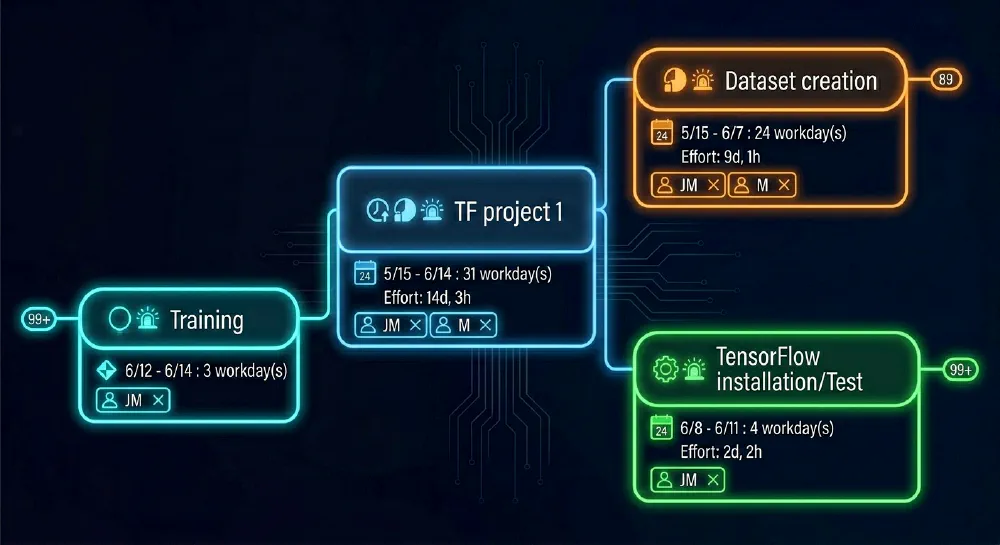
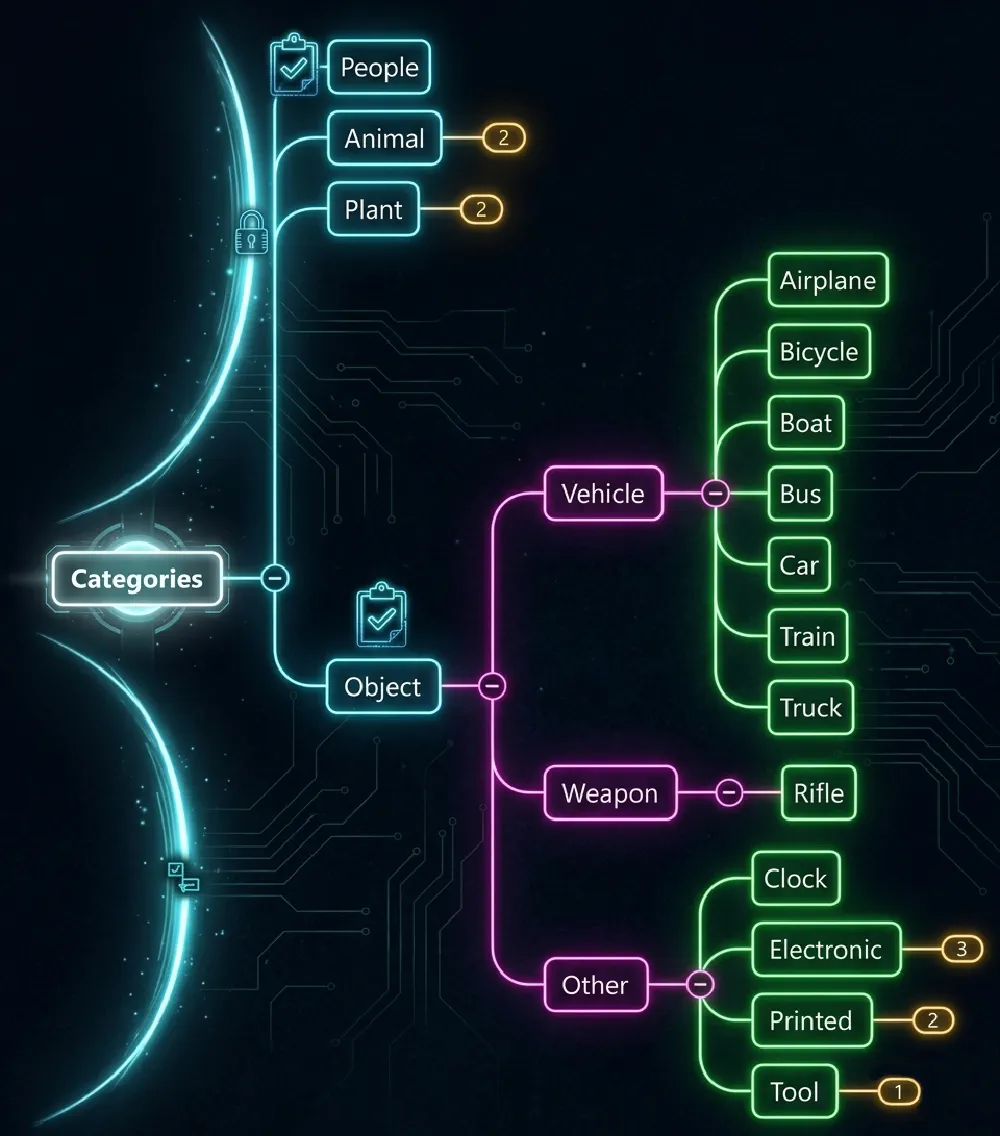
In this example, the project involves object detection and recognition implemented using Python, OpenCV, and TensorFlow, together with models such as Faster R-CNN, Mask R-CNN, Fast R-CNN, R-CNN, SSD, and YOLO. The target objects were organized in a hierarchical, tree-like structure, grouped into major categories—people, plants, animals, and objects—each further divided into multiple levels of subcategories.
The work structure was organized into three primary phases:
- Dataset creation
- TensorFlow installation and testing
- Model training
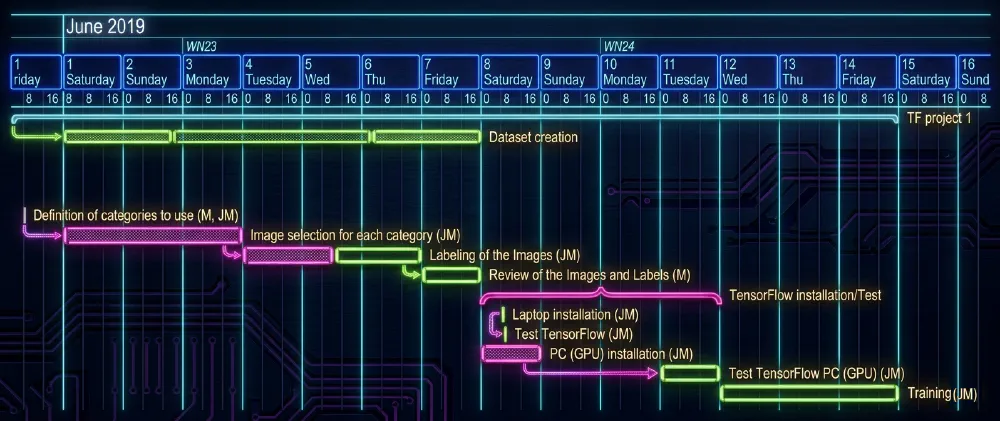
Figure 1 presents a global overview of the machine vision project. The project involved two human resources; however, time-related information is not emphasized, since the work was conducted alongside other non-AI-related activities. The example is intended solely to illustrate how mind maps can be used to visualize and manage AI projects effectively.
At a more detailed level, the dataset creation phase was decomposed into the following tasks: dataset selection, dataset download, selection of the number of images per category, definition of categories, image selection for each category, image labeling, and review of images and labels.
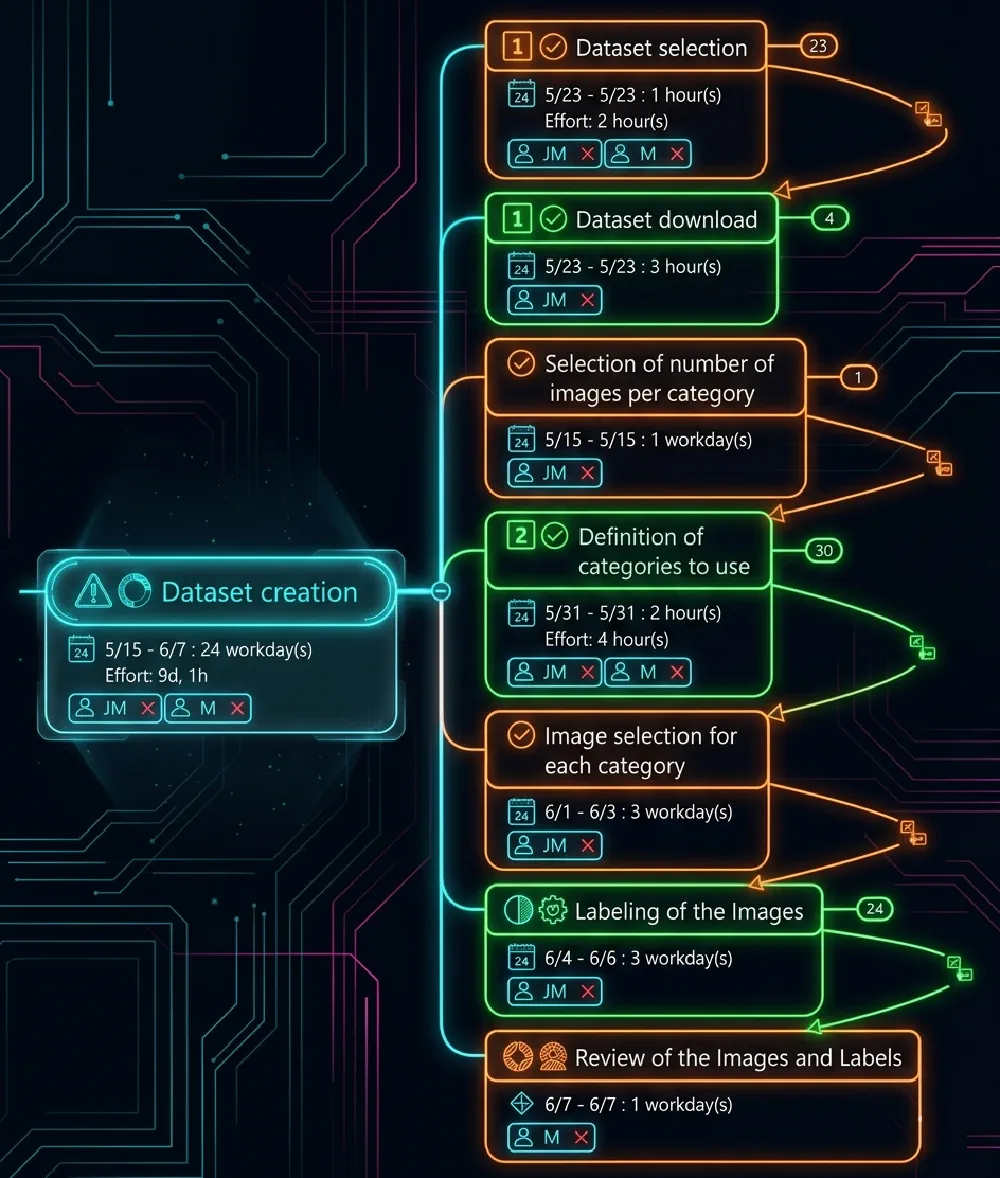
Figure 3 illustrates how mind mapping can be used to document dataset selection decisions. One of the key advantages of this approach is that the same mind map can serve simultaneously as a planning, tracking, and documentation tool throughout all project phases.
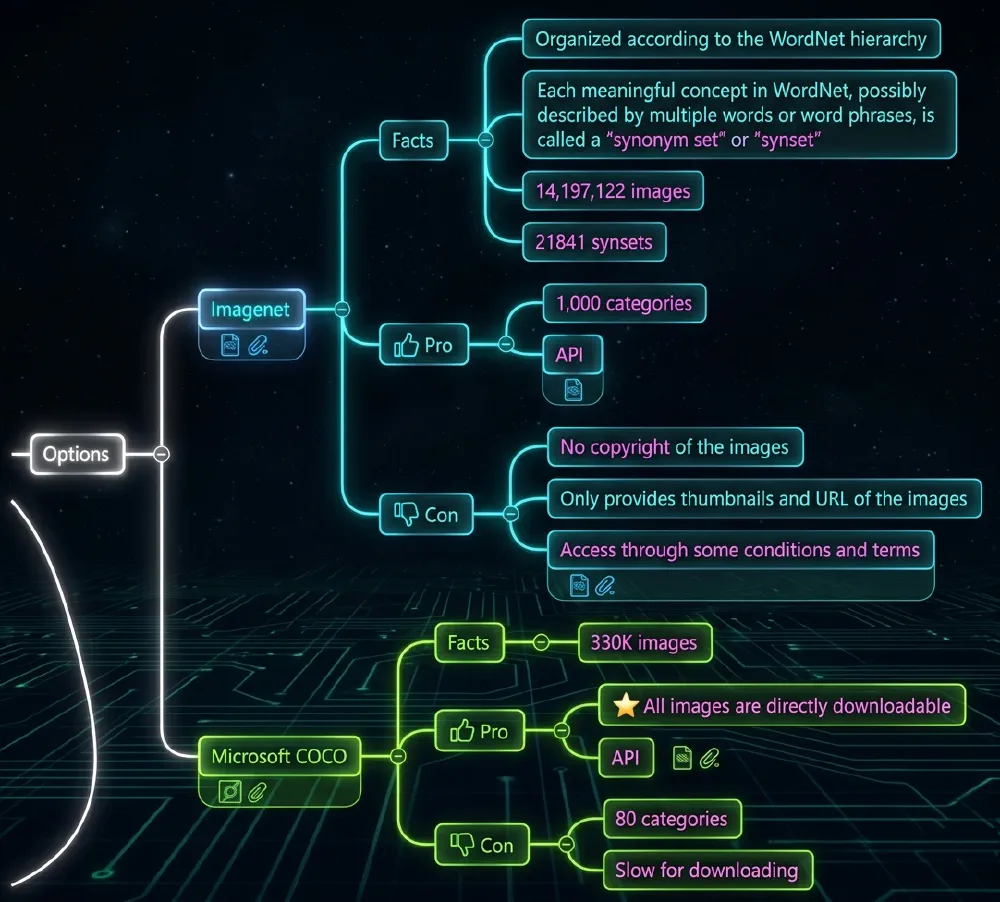
The categories used for object detection are also integrated into the mind map to support both documentation and development activities. Employing a hierarchical category structure simplifies the development of more complex AI applications by reducing cognitive load and improving clarity.
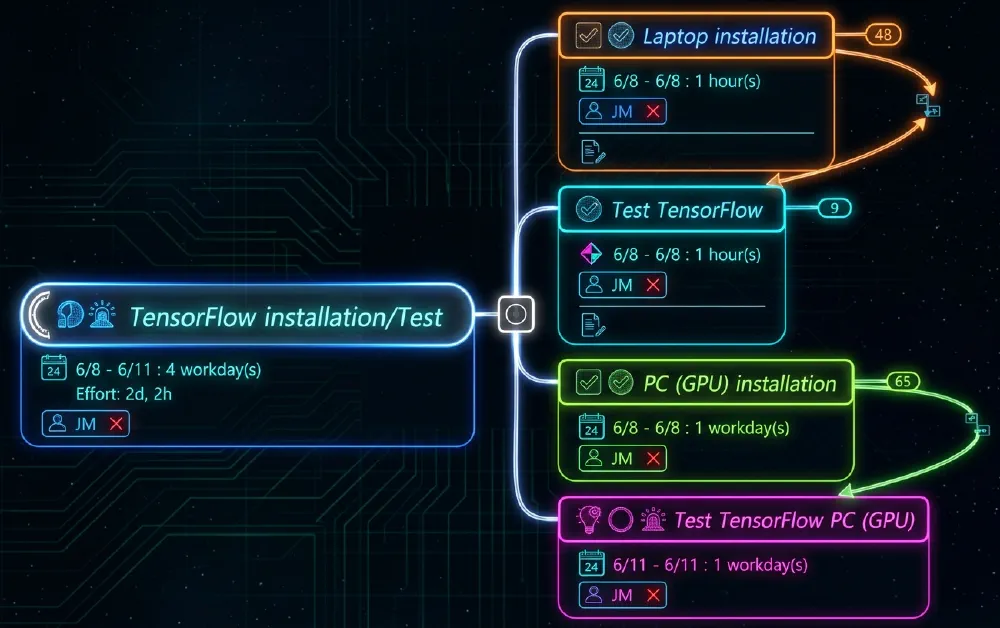
TensorFlow installation and testing were performed on both a laptop using a central processing unit (CPU) and a desktop PC equipped with a graphics processing unit (GPU).
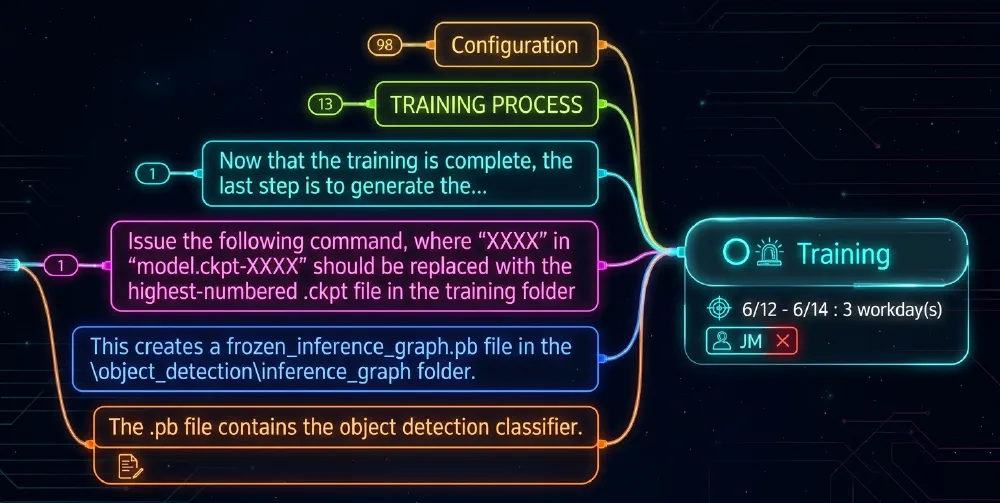
The final project phase involved model configuration, training, and the generation of the object detection classifier.
By linking the main project mind map to a Gantt chart, the project team can more easily monitor resource allocation and track progress on critical-path tasks. This integration also enables advanced scheduling adjustments, report generation, and visual analysis of resource usage.
Knowledge Mind Maps for Knowledge Management
Knowledge management focuses on the capture, sharing, and reuse of knowledge within and across organizations. Many advanced knowledge management systems already incorporate AI technologies such as Bayesian reasoning, ontologies, data mining, and intelligent agents.
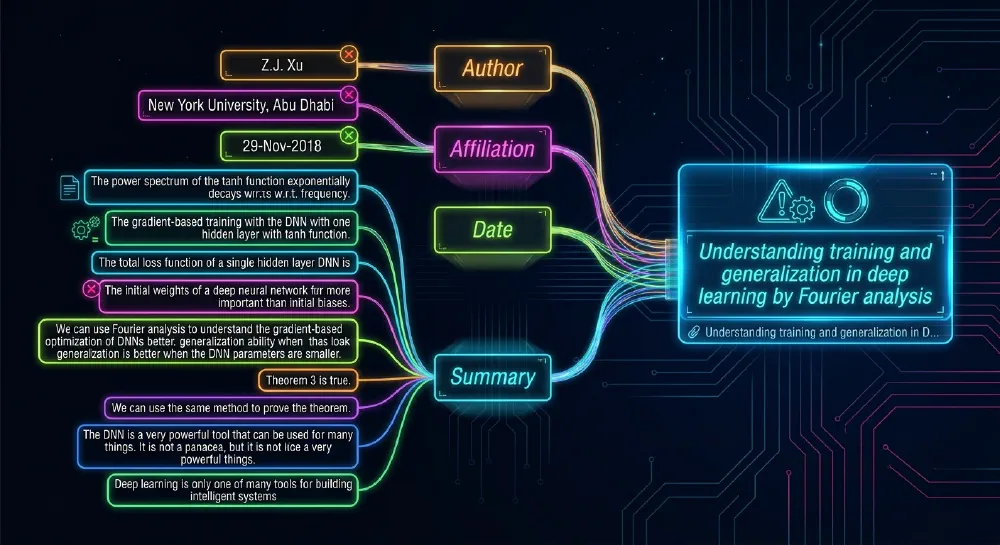
One effective application of mind mapping in this domain is the summarization of scientific articles. The primary goal is to distill the most important ideas, facts, and conclusions into a concise and visual format.
As an example, the article “Understanding Training and Generalization in Deep Learning by Fourier Analysis” was summarized using Python in conjunction with the OpenAI GPT-3 API. When translated into a mind map, the summary provides a structured and expanded visual representation of the article’s key concepts.
Analyzing and Notating Research Articles
Although the above outline is typical of what we would get from a “summary” of a research article, the following instructions are suggested for analyzing and notating a research article for reference and future use:
1. Identify the “Big Questions”
- What is the problem the authors are trying to solve with their research (not “what is this paper about”)?
- What problem is this particular subset of the scientific community or field trying to solve?
- How does this particular research fit into that bigger (scientific field) picture?
2. Summarize the research background
- Provide a paragraph of 5-10 sentences or less.
- What work has been done before in this field to answer the Big Questions referenced previously?
- What are the limitations of that work?
- What, according to the authors, needs to be done next?
3. Identify the more “Specific Questions”
- What exactly are the authors trying to answer with their research? There may be just one question or multiple (list them all).
4. Identify the Hypothesis
- Identify the author’s “Hypothesis” or “Null-Hypothesis.” What do they believe they will accomplish specifically?
5. Identify the Approach
- What approach will the authors use to prove their hypothesis? What are they going to do to answer the “Specific Question(s)”?
6. Outline the “Methods” being used
- Create an ordered list (and even a diagram) labeling/explaining the main steps and any specific functions used in the process.
- This information should be sufficient to explain it to someone who is not in the field.
- This should break out the “specifics” well enough that they can be used elsewhere for similar research.
7. Outline the results with summaries
- Write one or more paragraphs to summarize the results for each experiment, each figure, and each table.
- Provide a link for reference of each one to learn more about what the terms or data mean, or simply add a small blurb with a short description.
8. Interpret Conclusions and Discussions
- What do the authors think the results mean?
- Do you agree with them or can you come up with any alternative way of interpreting them?
- Do the authors identify any weaknesses in their own study? Do you see any that the authors missed?
- What do they propose to do as a next step? Do you agree with that?
With answers to the above questions, researchers can obtain a better idea of what the research article is saying, the methodology involved, and how portions of it might be utilized in subsequent research. Creating a mind map of this information improves visibility and understanding even further.
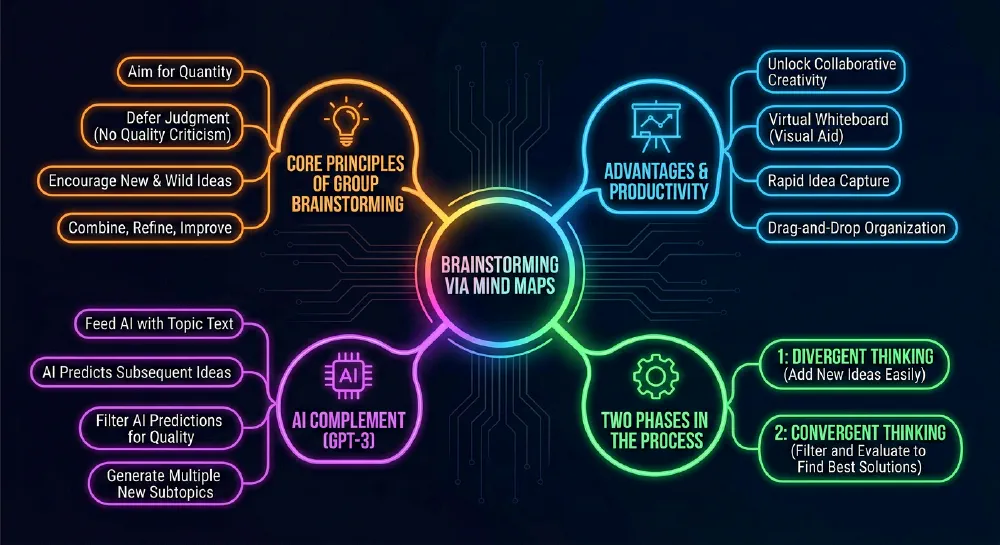
Group Brainstorming via Mind Mapping
Group brainstorming supported by mind mapping is a highly effective technique for defining a clear path forward while fostering collaboration and creativity. The fundamental principles of brainstorming—aiming for idea quantity, deferring judgment, encouraging unconventional ideas, and iteratively refining concepts—are naturally supported by mind maps.
Mind maps function as virtual whiteboards, enabling participants to capture ideas quickly and organize them visually through simple drag-and-drop interactions. This approach typically results in more productive brainstorming sessions.
The brainstorming process is commonly divided into two phases:
- Divergent thinking: Rapid and unrestricted generation of ideas.
- Convergent thinking: Evaluation, refinement, and selection of the most promising ideas.
Visual maps—often incorporating diagrams or flowcharts—are created by linking initial ideas with lines and arrows, progressively branching into more detailed concepts.
AI models can further enhance this process. A selected topic from the mind map can be used as input to the AI model, which then proposes relevant subtopics. These suggestions are filtered for quality, and the refined results can be fed back into the AI to generate deeper and more specific layers of the visual map.