If there is one universal truth I have learned over two decades in information security, it is this: More data does not equal more security.
In the early 2010s, the prevailing industry mantra was “log everything.” We dumped petabytes of raw system events, firewall drops, and proxy logs into monolithic SIEMs, hoping that if a breach occurred, the data would miraculously piece itself together. Fast forward to today, and that approach has proven to be a fiscal and operational disaster. Instead of finding the needle, we effectively built larger haystacks—and then set them on fire.
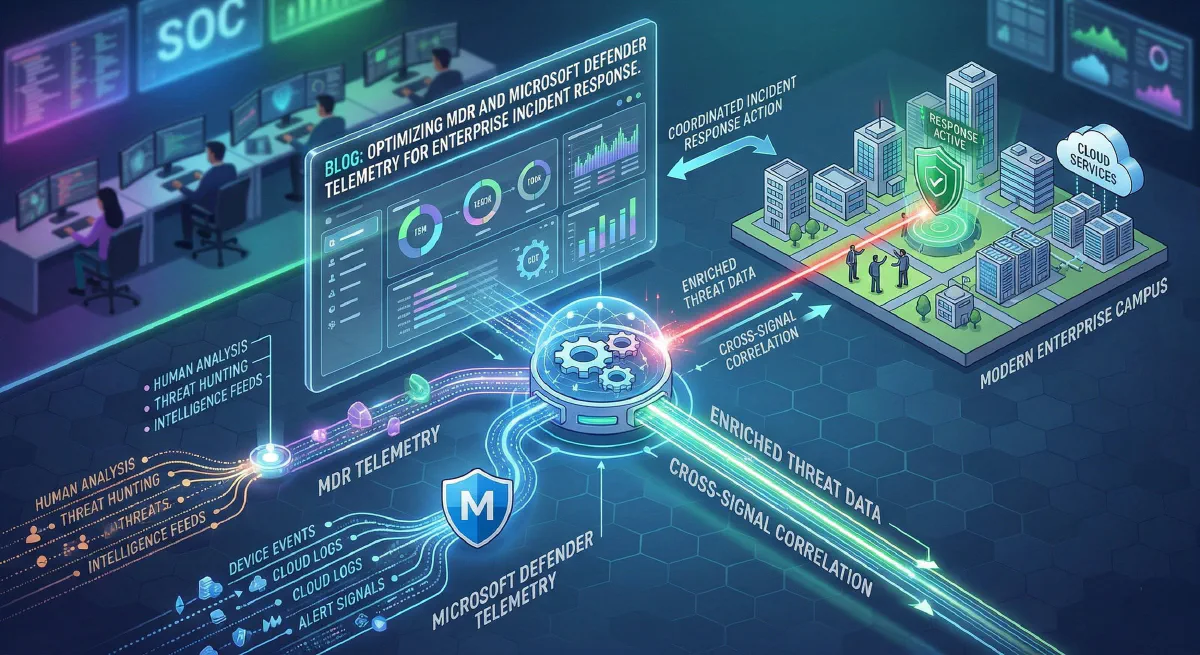
Modern Enterprise Incident Response (IR) requires surgical precision. With the rapid evolution of Microsoft’s Unified Security Operations Platform (USOP)—which officially bridges the gap between Microsoft Defender XDR and Microsoft Sentinel—the game has fundamentally shifted. For organizations partnering with Managed Detection and Response (MDR) providers, success no longer hinges on sheer log volume. It hinges on telemetry optimization.
Let’s dive deep into the architecture, tactics, and technical leadership required to optimize Microsoft Defender telemetry, drastically reduce Azure ingestion costs, and empower your MDR to execute lightning-fast incident response.
The Telemetry Tsunami and the “SIEM Tax”
A common architectural flaw I see in enterprise environments is the over-provisioning of data pipelines to third-party MDRs or internal SIEMs. By default, turning on raw telemetry connectors for Microsoft Defender for Endpoint (MDE), Defender for Identity (MDI), and Defender for Cloud Apps (MDCA) will unleash a veritable tsunami of data.
When every benign DeviceProcessEvent, routine network connection, and standard Entra ID sign-in is piped as an analytics-grade log, two things happen:
- Analyst Fatigue: High-fidelity alerts get buried under operational noise.
- The SIEM Tax: Your cloud consumption bills skyrocket.
Your MDR provider doesn’t need to see every time svchost.exe makes a DNS request to a trusted internal domain. They need correlated, high-fidelity signals that indicate lateral movement, privilege escalation, or defense evasion.
Architecting the Defender Stack for the Modern MDR
To build a high-performing IR capability, we have to look at how we tune the four primary pillars of the Microsoft Defender XDR stack before that data ever reaches your MDR’s monitoring queue.
1. Defender for Endpoint (MDE): Taming the Endpoint
MDE is arguably the noisiest component of the stack. To optimize endpoint telemetry:
- Suppress at the Source: Utilize Defender’s built-in Indicator of Compromise (IoC) exclusions and advanced hunting suppression rules. If your organization uses a custom, high-volume internal application that routinely touches thousands of files, whitelist its expected behaviors globally to prevent MDE from generating thousands of informational events.
- Leverage EDR Block Mode: Ensure your environment is utilizing EDR in block mode. This prevents malicious artifacts from executing in the first place, changing the MDR’s job from active firefighting to post-event validation.
2. Defender for Identity (MDI) & Entra ID: Finding the Anomalies
Identity is the modern perimeter. Attackers don’t break in; they log in.
- Correlate, Don’t Replicate: Instead of shipping all raw Active Directory Event Tracing (ETW) logs to your MDR, rely on MDI to parse the noise. MDI evaluates the raw data on the domain controller and only escalates actionable alerts (e.g., DCSync attacks, Pass-the-Ticket, suspected Golden Ticket usage).
- Entra ID Risk Data: Pipe Entra ID Identity Protection alerts rather than raw
SignInLogs. Let Microsoft’s native machine learning evaluate the impossible travel and anomalous token usage, sending only the high-risk events to the active IR queue.
Elite Tactics: Pipeline Optimization and Data Tiering
For environments routing data through Microsoft Sentinel to their MDR, optimization requires a tactical approach to data ingestion.
Tactic 1: Data Collection Rules (DCRs) & KQL Transformations
Introduced as a massive cost-saving and tuning mechanism, DCRs allow security architects to filter data before it hits the Log Analytics workspace. By applying KQL (Kusto Query Language) transformations at the pipeline edge, you can drop benign data.
For example, dropping trusted vulnerability scanner traffic from your network logs:
source
| where not(RemoteIP == "10.0.50.5" and ActionType == "ConnectionSuccess")
// 10.0.50.5 is the authorized enterprise vulnerability scanner
By implementing just a few targeted DCRs, I have routinely seen enterprises cut their XDR-to-SIEM ingestion volume by 30% to 40% without sacrificing a single drop of security visibility.
Tactic 2: Basic Logs vs. Analytics Logs
Not all data is created equal.
- Analytics Logs: High-value telemetry (
DeviceProcessEvents,AlertInfo,SecurityIncident) should reside in the Analytics tier. This allows for rapid, complex KQL threat hunting by your MDR analysts and triggers automated playbooks. - Basic Logs: High-volume, low-value telemetry (firewall drops, proxy access logs, routine NetFlow) should be routed to the Basic Logs tier. These logs are retained cheaply for compliance and retrospective forensic investigations, but they don’t bloat the expensive active hunting workspace.
Empowering Incident Response (The “R” in MDR)
Telemetry tuning is ultimately about speed. When the noise is stripped away, the MDR can leverage the deep integration of the Microsoft Unified Security Operations Platform to respond at machine speed.
An optimized architecture allows for Bidirectional Automated Response. When your MDR detects an anomalous PowerShell execution via MDE:
- Host Isolation: An API call or native Sentinel playbook triggers MDE to isolate the host from the network, leaving only the management channel open for forensics.
- Identity Revocation: Simultaneously, a signal is pushed to Entra ID to revoke the compromised user’s session tokens and force a strict Conditional Access policy requiring Phishing-Resistant MFA to re-authenticate.
- Automated Investigation and Response (AIR): Defender’s native AIR capabilities spin up, automatically pulling memory dumps, analyzing connected files, and building a comprehensive incident graph for the human MDR analyst to review.
In this optimized state, the Mean Time To Respond (MTTR) drops from hours to minutes—and in the case of automated playbooks, seconds.
Conclusion
As security leaders, we must move beyond the archaic mindset of data hoarding. The modern threat landscape moves too quickly for human analysts to sift through millions of raw, unoptimized events.
By leveraging Data Collection Rules, tiering your storage, utilizing Microsoft’s native machine learning capabilities, and feeding your MDR provider only high-fidelity, actionable telemetry, you do more than just save money on your Azure bill. You create a streamlined, lethal Incident Response architecture capable of stopping advanced adversaries in their tracks.
Optimize the signal. Drop the noise. Empower the response.
About the Author Sam Jobes, CISA-CISSP, is a 20-year information security veteran specializing in enterprise security architecture, GRC automation, and building scalable infosec programs for high-growth technology companies.