
Project Overview
The Quantitative Theory Engine is a personal research project focused on learning quantitative stock analysis and developing automated investment strategies. It is decoupled from my professional information security roles and serves as a technical sandbox for algorithmic finance.
Infrastructure & Stack
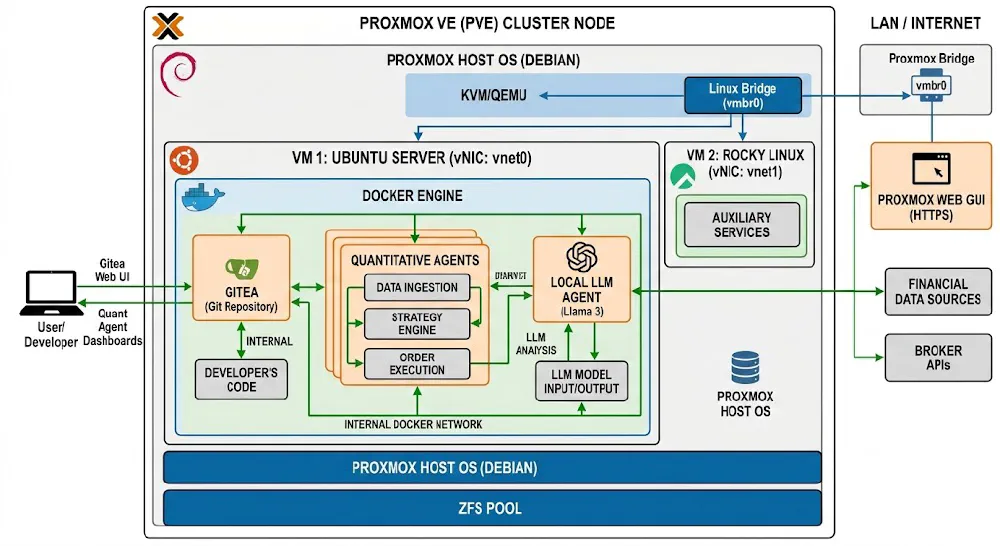
The engine is hosted within my local Debian VM Lab environment on a Proxmox hypervisor.
- Host Hardware: 96GB RAM dedicated to intensive modeling tasks.
- Orchestration: Docker containers manage the core processing units.
- AI Integration: Utilizing Ollama (Llama 3.3 70B & Qwen3-Coder) for natural language data processing and code optimization.
Engineering the Quantitative Theory Engine
The transition from qualitative “gut feel” investing to a rigorous, data-driven methodology requires a robust technical foundation. My current focus is the development of the Quantitative Theory Engine, a localized infrastructure designed to ingest, process, and analyze global equity data.
This project is a departure from my Information Security roots, yet it relies heavily on the same principles: data integrity, systems architecture, and automated pipeline resilience.
The Architectural Foundation: Localized Infrastructure
To maintain complete control over the analytical environment and avoid the latency or cost constraints of cloud-based specialized platforms, the engine is hosted within my local laboratory.
- Virtualization Layer: The environment runs on a Proxmox hypervisor, utilizing a Debian VM with 96GB of RAM. This provides the vertical scaling necessary for memory-intensive backtesting and large-scale data manipulation.
- Containerization: Services are siloed using Docker. This ensures that the ingestion scripts, database engines, and analytical front-ends (Open WebUI) remain decoupled and easily maintainable.
- Version Control: All logic, from SQL schemas to Python-based analysis scripts, is managed through a local Gitea instance.
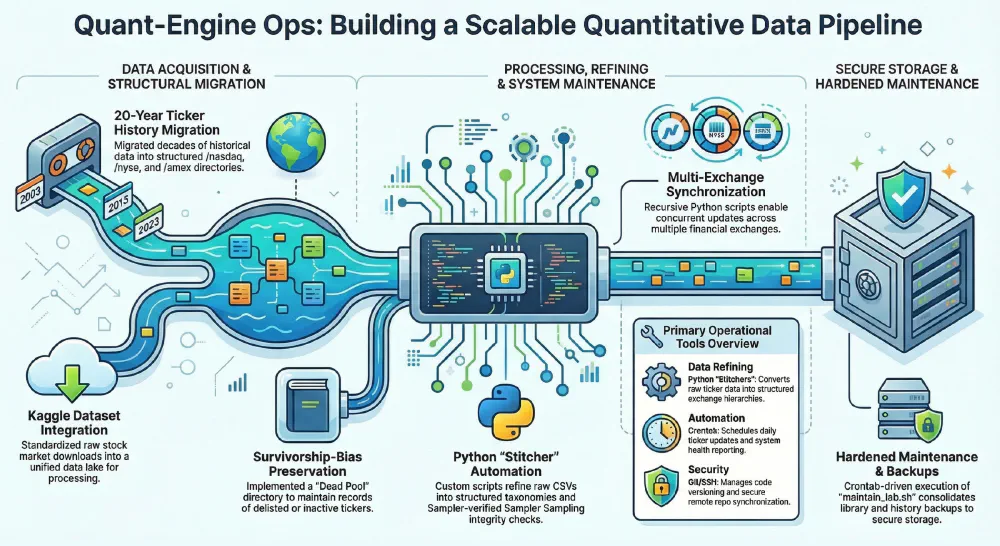
Phase 1: Data Ingestion and Normalization
A quantitative engine is only as effective as the telemetry it consumes. The first phase focused on building a resilient “pull” architecture for stock data.
Key Implementation Details:
- Multi-Source Ingestion: We have implemented scripts to fetch historical OHLCV (Open, High, Low, Close, Volume) data.
- Normalization Pipelines: Raw API responses are seldom ready for analysis. We built a series of Python-based transformers to handle:
- Dividend Adjustments: Ensuring historical prices reflect total return accurately.
- Currency Standardization: Normalizing global equities to a base currency for cross-market comparison.
- Missing Data Interpolation: Using forward-fill logic to handle holiday-induced gaps in multi-exchange datasets.
Phase 2: Statistical Analysis and Signal Generation
With the data stabilized, the focus shifted to the Theory Engine itself. This layer is where raw data is transformed into actionable mathematical signals.
Quantitative Methodology:
- Exploratory Data Analysis (EDA): Utilizing Qwen2.5-Coder and Llama 3.3 70B (hosted locally via Ollama) to assist in writing complex Pandas/NumPy logic for correlation matrices and volatility clustering.
- Factor Modeling: We have begun testing classic factors—Momentum, Quality, and Value—against the historical data to determine their predictive power in current market regimes.
- Technical Indicators: Custom implementation of RSI, MACD, and Bollinger Band deviations, calculated directly within the database layer to maximize performance during large-scale screening.
Current Status: The Quant Sandbox
The project is currently in the “Sandbox” stage. I am integrating Open WebUI as the primary interface for interacting with the engine. This allows for natural language querying of the quantitative data—for instance, “Show me all tickers with a debt-to-equity ratio below 0.5 and a 20-day price momentum in the top decile.”
The engine then translates this into a structured SQL query, executes it against the local database, and returns the result set for further manual review.
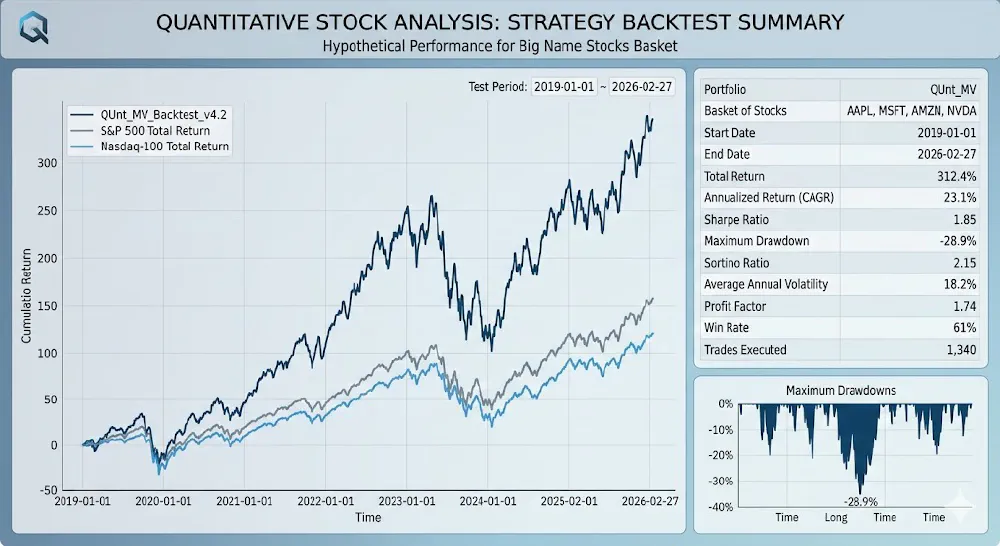
The Road Ahead: Backtesting and Execution
The next critical milestone is the construction of the Backtesting Module. It is not enough to find a signal; we must prove it would have survived historical market cycles.
- Walk-Forward Optimization: Validating that our “theories” hold up on out-of-sample data.
- Risk Management Overlay: Integrating Kelly Criterion and VaR (Value at Risk) calculations into the signal generation process.
- Automated Reporting: Generating Markdown-based performance summaries that can be reviewed daily.
This project represents the convergence of high-performance computing and financial theory—a personal “infrastructure-as-a-service” model tailored for capital growth.
[!NOTE] This project is for personal research, it remains separate from my career and professional activities.